
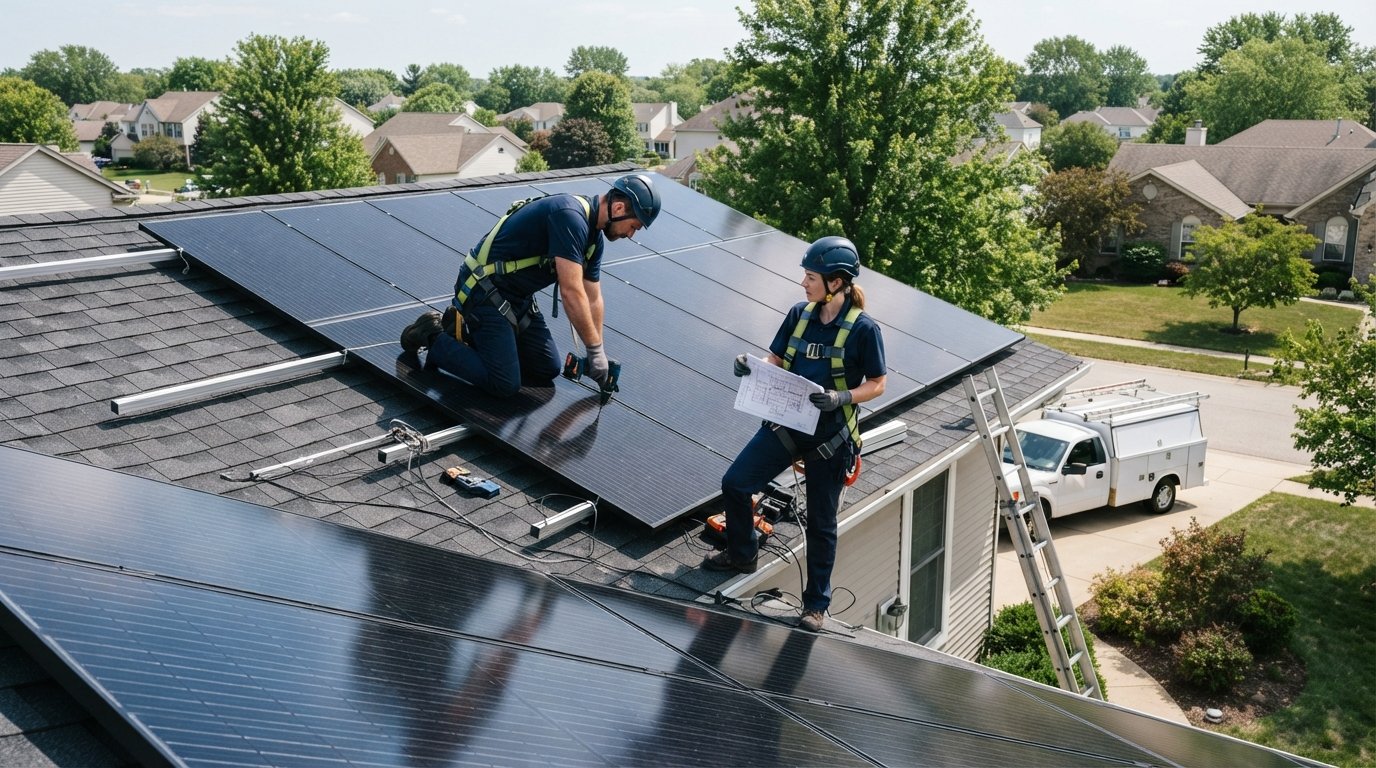
Solar Panel Installation Cost and Payback by State (2026)
Solar panel installation cost and payback by state varies widely. Call (833)-439-3727 to compare local installer quotes and estimate your savings.

By Alice Miller
Learn more about Solar Panel Installation and Repair for guides, costs, and what to expect.
Compare Solar Panel Installation and Repair Pros Near You

Enter your ZIP code to compare top-rated local professionals and request free quotes.
Rooftop solar is one of the few home upgrades that can pay for itself, but the numbers swing wildly depending on where you live. A 6 kW system might cost $16,000 in one state and $22,000 in another, and the payback period can stretch from six years to fifteen. Before you sign a contract, you need a clear picture of what solar panel installation cost and payback by state actually looks like in your market, how to read a production estimate, and which incentives are still available in 2026. This guide walks through the real math, the regional variables, and the vetting steps that separate a solid investment from an expensive mistake.
What Drives Solar Panel Installation Cost in 2026
The national average for a residential solar installation sits near $2.70 to $3.00 per watt before incentives, which puts a typical 6 kW system at roughly $16,200 to $18,000. That is a broad range, and it hides a lot of variation. A 10 kW system on a larger roof often comes in at a lower per-watt price because soft costs like permitting, design, and crew mobilization are spread across more panels. Conversely, small systems under 4 kW carry a higher per-watt premium. Understanding per-watt pricing is the first step in comparing quotes fairly.
Beyond system size, several factors move the needle. Roof complexity (multiple planes, dormers, skylights) adds labor and mounting hardware. Panel quality and inverter choice matter: premium modules and microinverters cost more upfront but can perform better in shade. Battery storage is a separate line item, typically $8,000 to $15,000 installed, and it changes the payback equation significantly. Local permitting fees and inspection timelines also vary by jurisdiction, and those costs get baked into the installer's quote.
One often-overlooked cost driver is roof condition. If your roof is within five to seven years of replacement, many installers will recommend re-roofing before panels go up. Removing and reinstalling solar later adds $2,000 to $4,000 in labor, so it is smarter to address the roof first. This is a gating factor: no reputable installer wants to mount panels on failing shingles. If you are planning a larger renovation that includes roofing or other upgrades, it helps to map out the full project sequence. Our guide on smart home installation costs and planning covers how to phase upgrades efficiently.
Federal Tax Credit Mechanics and State Incentive Differences
The federal residential clean energy credit remains the biggest single incentive in 2026. It covers 30 percent of qualified solar costs, including panels, inverters, labor, and battery storage, with no dollar cap. The credit is non-refundable, meaning it reduces your tax liability but does not generate a check beyond what you owe. If your tax bill is lower than the credit, you can carry the unused portion forward to future years. To claim it, you need a completed system in service during the tax year and proper documentation from your installer.
State incentives are where the map really diverges. Some states offer direct rebates, others provide property tax exemptions, and a few have state-level tax credits on top of the federal one. Here is a snapshot of how common incentive types compare:
- State tax credits: A handful of states offer credits ranging from 10 to 25 percent of system cost, sometimes capped at a few thousand dollars.
- Rebates: Utility-sponsored or state-funded rebates, often tied to system size or performance, can shave $1,000 to $5,000 off the upfront price.
- Property tax exemptions: Many states exempt the added home value from property taxes, which protects you from a higher assessment after installation.
- Sales tax exemptions: Some states waive sales tax on solar equipment, saving several hundred dollars at purchase.
- Net metering rules: Not a cash incentive, but it directly affects payback by determining how you are credited for excess power.
These incentives are not uniform, and they change. A state with a strong rebate and full net metering can cut payback by three to five years compared to a neighboring state with neither. When you request quotes, ask each installer to itemize which incentives they have included and which you must apply for yourself. Do not assume the quote reflects every available program.
Utility Rates, Net Metering, and Payback Math
Payback is fundamentally a math problem: total installed cost after incentives divided by annual savings. Annual savings depend on how much electricity your system produces and how your utility credits that production. In states with high electricity rates, like California, Massachusetts, and Hawaii, solar savings per kilowatt-hour are larger, which shortens payback. In states with low rates, like Louisiana or Oklahoma, the same system saves less per year, pushing payback out even if installation costs are similar.
Net metering is the other half of the equation. Under full net metering, you receive a credit at the retail rate for every excess kilowatt-hour you export, which maximizes savings. Under weaker policies, like avoided-cost crediting or export compensation at a fraction of retail, the value of excess production drops sharply. Some utilities have moved to time-of-use rates that reward production during peak hours, which can favor systems paired with batteries. A simple framework for estimating payback looks like this:
- Estimate annual production in kWh from your installer's production model.
- Multiply by the portion of production you self-consume and the portion exported, using the correct credit rate for each.
- Apply your utility's rate escalation assumption (typically 2 to 4 percent per year).
- Divide net installed cost by first-year savings to get a rough payback, then refine with escalation.
That framework is only as good as its inputs. Production estimates vary by installer, and optimistic assumptions can make payback look better than it is. Ask for the modeling assumptions in writing: panel degradation rate, shading losses, inverter efficiency, and rate escalation. A credible installer will show a range, not a single number.
Solar Panel Installation Cost and Payback by State: Regional Patterns
While exact figures shift with local pricing and policy, clear regional patterns emerge. High-cost, high-rate states tend to have higher gross installation costs but faster payback because utility savings are large. Low-cost, low-rate states have cheaper systems but slower payback. The table below summarizes typical ranges; treat them as planning benchmarks, not quotes.
- California: Gross cost near $3.00 to $3.40 per watt; strong sun and high rates support payback in the 5 to 8 year range, though net metering changes have altered export credits.
- Massachusetts: Higher labor and permitting costs push gross pricing up, but high electricity rates and state programs keep payback competitive at roughly 7 to 10 years.
- Texas: Lower installation costs and abundant sun, but weaker net metering and moderate rates yield payback around 9 to 12 years.
- Florida: Moderate costs, good production, and favorable policy support payback near 8 to 11 years.
- Arizona: Strong sun and competitive installer market; payback often lands in the 7 to 10 year range despite modest net metering.
- New York: High costs offset by high rates and state incentives; payback typically 8 to 11 years.
- Illinois: Moderate costs and improving policy support; payback around 9 to 12 years.
These ranges assume a cash purchase and the full federal credit. Financed systems have a different cash flow: the loan payment may offset most or all of the utility savings in early years, so payback in the traditional sense is less relevant than monthly net cost. If you finance, compare the loan payment to your pre-solar electric bill and account for the federal credit being applied to the loan balance.
Regional contractor availability also affects pricing. Competitive markets with many established installers tend to have tighter margins and better pricing. In areas with fewer installers, quotes can run higher. This is one reason it pays to gather multiple bids and compare line items, not just totals. A directory like PlanRemodel can help you find pre-vetted contractors in your area and request several quotes without obligation.
Roof Age and Condition: The Gating Factor
No payback calculation matters if your roof cannot support the array. Most solar panels carry 25-year performance warranties, and the mounting hardware is designed to last as long. If your shingles have 10 years of life left, you are likely to face a removal and reinstallation cost that erases a chunk of your savings. Installers will inspect roof age, decking condition, and structural integrity during the site assessment. Some will walk away from a roof they consider marginal; others will install anyway, which is a red flag.
The practical rule: if your roof is 15 years or older, get a roofing inspection before finalizing solar plans. If replacement is needed within five years, do the roof first. This sequencing also makes financial sense because the 30 percent federal credit applies to solar equipment, not roofing, so bundling the projects does not magically discount the roof. Planning the order of operations saves money and avoids the headache of a mid-warranty teardown.
Vetting Solar Installers and Reading Production Estimates
Solar is a high-ticket purchase sold by a mix of established local firms, regional players, and national companies with aggressive sales tactics. The quality gap is real. Vetting starts with licensing and insurance: confirm the contractor holds the required state or local license for electrical and roofing work, and ask for a certificate of insurance. Check whether the company uses subcontractors for installation, because that affects accountability. Look for a track record of at least several years and verifiable references from installations similar to yours.
Then dig into the production estimate. A credible proposal includes a shading analysis, the modeling tool used, assumptions about panel degradation, and a clear statement of expected year-one production. Ask what happens if actual production falls short: some installers offer production guarantees, others do not. Compare quotes on a level playing field by normalizing system size, panel model, inverter type, and warranty terms. The lowest price per watt is not automatically the best deal if it comes with weaker equipment or a thin workmanship warranty.
Finally, read the contract carefully. Look for the payment schedule, completion timeline, change-order process, and warranty details. Avoid large upfront deposits; a reasonable schedule ties payments to milestones. If a salesperson pressures you to sign on the spot or offers a discount that expires today, treat that as a warning sign. The best solar decisions are made after comparing multiple quotes and sleeping on it.
Solar panel installation cost and payback by state comes down to a few controllable variables: your roof condition, your utility's rate structure, the incentives you claim, and the quality of the installer you choose. Get those right, and the numbers tend to work. Get them wrong, and even a sunny roof can become a disappointing investment. Start with a roof assessment, gather at least three itemized quotes, and verify every incentive before you commit. The savings are real, but they reward homeowners who do the homework.
Learn more about Solar Panel Installation and Repair for guides, costs, and what to expect.
Compare Solar Panel Installation and Repair Pros Near You
Enter your ZIP code to compare top-rated local professionals and request free quotes.